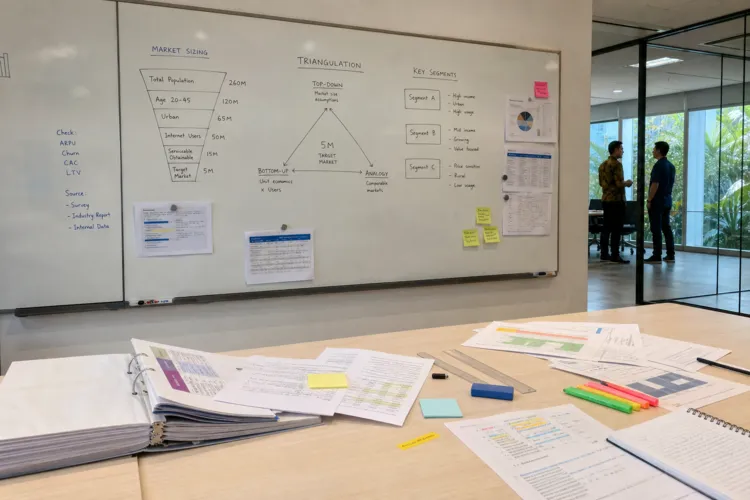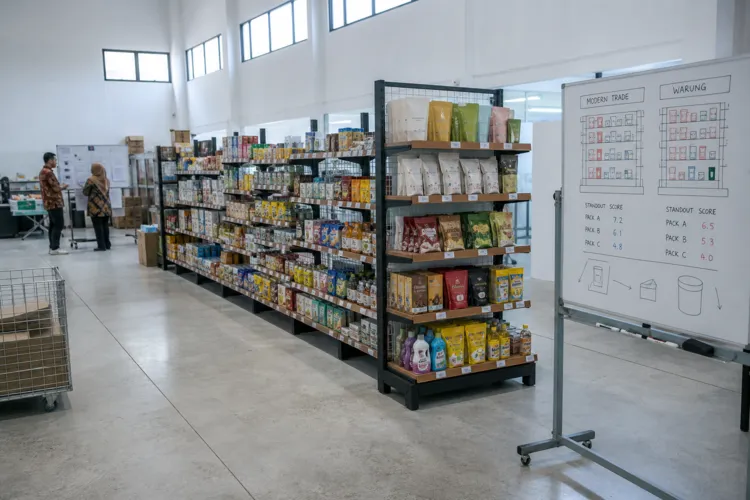
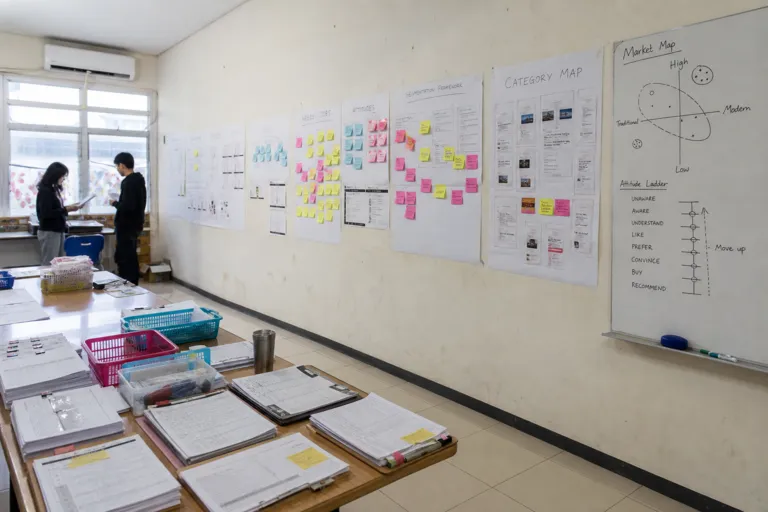
Planning growth in Indonesia often means dealing with fragmented signals: campaign metrics here, sales data there, and a few ad hoc surveys in between. A Usage and Attitudes (U&A) study is designed to cut through that noise by mapping two things at the same time: what people actually do in a category (usage, frequency, channels, and behaviors) and what they believe about it (attitudes, motivations, and barriers). The result is a panoramic category map that connects awareness through repeat behavior, so teams can stop debating anecdotes and start working from a shared baseline that supports real decisions.
A strong U&A baseline answers practical questions that Indonesia teams can use immediately. It clarifies what people buy, how they buy, when and where they use the category, and why they make those choices. It also looks beyond current customers by including non-users and competitor buyers, which creates a fuller picture than a typical customer survey. Done well, it reveals the intersection between behaviors and beliefs—for example, not only which groups use the category more often, but what drives their choices and what stops other groups from buying. That intersection is where unmet needs and “white space” opportunities tend to emerge.
What to Measure to Turn Insights Into a Category Map
To guide brand strategy, the study needs measures that teams can act on, not just describe. U&A research commonly covers usage patterns (how often, when, and in what situations the category becomes part of a routine), attitudes and perceptions (what people believe, feel, or expect), and decision drivers and barriers that shape purchase. It can also map how different brands are perceived and identify gaps between category usage and current brand positioning. When the design deliberately mixes structured questions for the “how much/how often” with open-ended questions that capture motivations and barriers in customers’ own words, the output becomes a practical market map that supports segmentation, positioning, messaging, and innovation priorities.
Execution choices matter because U&A lives on subgroup analysis. For studies requiring robust segment-level reporting, MKOR typically recommends a baseline sample size of n=600–800, and n=1,000+ for multi-country or multi-category work where cross-tabulation depth is critical. The same source notes that for subgroup comparisons—such as urban versus rural, or users versus non-users—each subgroup should contain at least 100 respondents. This is also why many teams run U&A periodically, every few years, to fill gaps in knowledge about markets, behaviors, needs, and attitudes, then use the results to steer product development, marketing communications, and brand strategy with more confidence.
In practice, a usage and attitude study in Indonesia becomes a foundation layer that other programs build on. One approach is to run U&A first to establish the category map and select the right KPIs, then deploy brand tracking to monitor those KPIs at regular intervals and detect change over time. The U&A baseline can also feed concept development, product design, and messaging by revealing when people perceive features as complex or unnecessary, and by translating human insights into strategic decisions. The goal is not a slide deck of disconnected findings, but an actionable framework that helps teams prioritize segments, sharpen positioning, and move faster with a clear direction.
What is a Usage and Attitudes (U&A) study?
Why run a usage and attitude study in Indonesia before brand tracking?
What sample sizes are typically recommended for U&A studies?
What does a U&A baseline help brand teams do?