
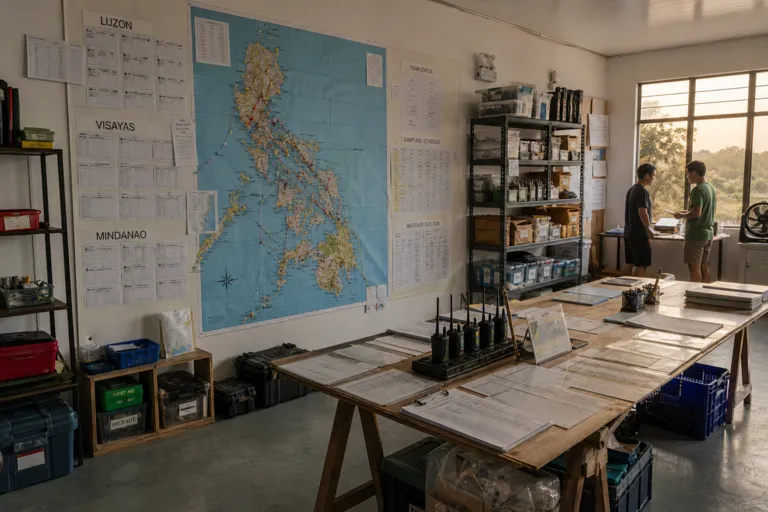
Sample size planning in the Philippines is not only a statistical exercise. It is also a geography and access problem. The country is an archipelago of 7,600 islands grouped into three major island groups: Luzon, Visayas, and Mindanao. Multiple sources warn that consumer behavior and channel preference can differ across Metro Manila, provincial Luzon, the Visayas, and Mindanao, so designs that treat the market as one uniform population can end up reading one place as “the Philippines.” Online panels can also skew toward Metro Manila and urban Luzon, which can inflate capital-region demographics if you do not actively manage geographic balance.
Because geography can drive bias, start by making explicit coverage decisions and then matching fieldwork modes to where people actually live and respond. Iconic Research recommends explicit geographic stratification across Luzon, Visayas, and Mindanao for national representation. Context on urban concentration helps explain why purely online samples can tilt: one source cites a population of 115.8M with 55% urban (World Bank, 2024), while another notes an urban-rural split of approximately 48% urban and rising. If your recruitment leans too hard on convenience sampling, it may mirror the most connected areas, not the full archipelago.
How Many Respondents Do You Need by Purpose, Region, and Segment?
A practical sample size calculation in the Philippines should begin with the decision you need to make, then expand for regions and segments. Benchmarks from Southeast Asia project experience suggest 100–200 respondents can support directional insights and pitch validation, while 300–400+ respondents are used for more confident business decisions. The same guide ties 300–400 to about a ±5% margin of error at 95% confidence, and 100–200 to about ±7–10% at 95% confidence. Other references also state that for most surveys, 384 responses correspond to ±5% at 95% confidence, which is why teams often start around that range before layering on subgroup needs.
The moment you need reporting across regions and segments, you must plan bases within each cut, not only a national total. Lab42 highlights how sample planning often breaks when a team starts with n=400 and then asks to see results by multiple groups, because each group needs enough respondents on its own. For higher-complexity work, their benchmarks move upward: brand tracking is n=500 per wave at minimum for stable tracking metrics, and segmentation is n=500–1,000+ minimum, with 800–1,000 often recommended for more stable cluster or factor analysis solutions. For conjoint or MaxDiff, they cite n=200–400 for aggregate results, and n=150+ per segment if you need segment-level reads.
Finally, protect representativeness with mode choice and recruitment governance, not just larger n. Field options commonly used in the Philippines include online surveys (Google Forms and panels), telephone-based CATI, and face-to-face CAPI. Multiple sources recommend mixed methods so you can use online where coverage is strong and add CATI or CAPI where online reach is weaker or where you need tighter control of geography. Recruitment discipline matters because “Philippines” results can become “Metro Manila” results if selection is easiest in the capital; that failure mode is repeatedly flagged in guidance on respondent recruitment and archipelago sampling.
How should I approach sample size calculation in the Philippines for a national survey?
Is 100–200 respondents ever enough in the Philippines?
What happens to sample size when I need results by region or segment?
What sample sizes are typical for tracking and segmentation studies?
Which fieldwork modes can help reduce Metro Manila bias?